NMES
138 patients: sizing a trial for electrical stimulation in the PICU
Context
Critically ill children in the ICU can lose significant muscle mass in a short time. The hospital's clinical team had already run a pilot observational study in the PICU and found a mean 25% reduction in quadriceps muscle cross-sectional area, present in 57% of patients — roughly 2.7% muscle loss per day. The open question was whether Neuromuscular Electrical Stimulation (NMES) could reduce or prevent that atrophy, and before running that trial, the team needed to know how many patients it would take.
Question
Not whether NMES helps at all, but by how much — and how confidently we needed to know it.
As originally posed, the question — does NMES reduce or prevent atrophy in critically ill pediatric patients? — assumes its own answer. It isn't really testable as worded, since any observed change technically satisfies it. Before I could size a trial, I had to fix what we were actually asking.
Approach & rationale
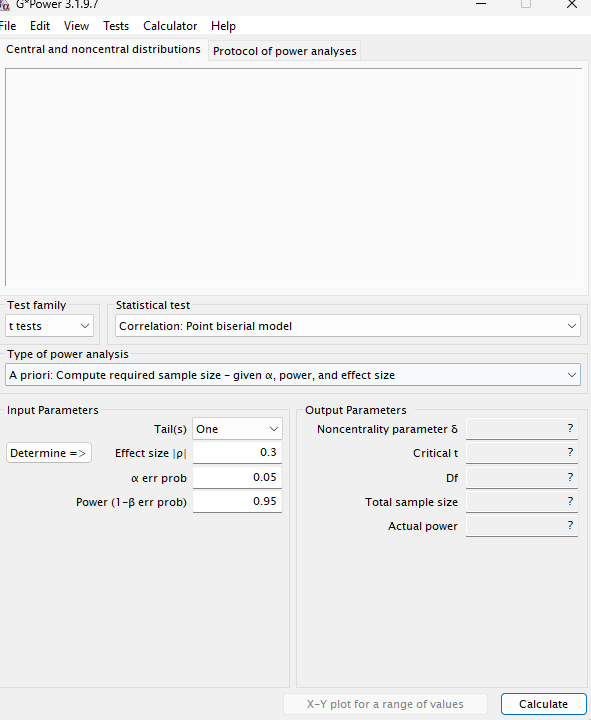
A sample-size calculation for a randomized controlled trial depends on three levers: power (the probability of detecting a real effect, commonly 0.80–0.90), alpha (the false-positive rate, usually 0.05), and the Minimal Clinically Important Difference (MCID) — the smallest change clinicians actually care about. I converted the clinician's MCID into Cohen's d, a standardized effect size, so it could plug into the sample-size formula. Set the MCID too large and the trial may miss a modest but real benefit; too small, and the trial needs far more participants to detect an effect that may not even be clinically meaningful.
Methodology & iteration
Both are valid: the tradeoff is that the broad question needs a larger N and a longer timeline (δ ≈ 10–15%), while the narrow question needs a smaller N and a sharper focus (a fixed ≥75% threshold).
Power for the observed effect
Reframe the question instead
In short
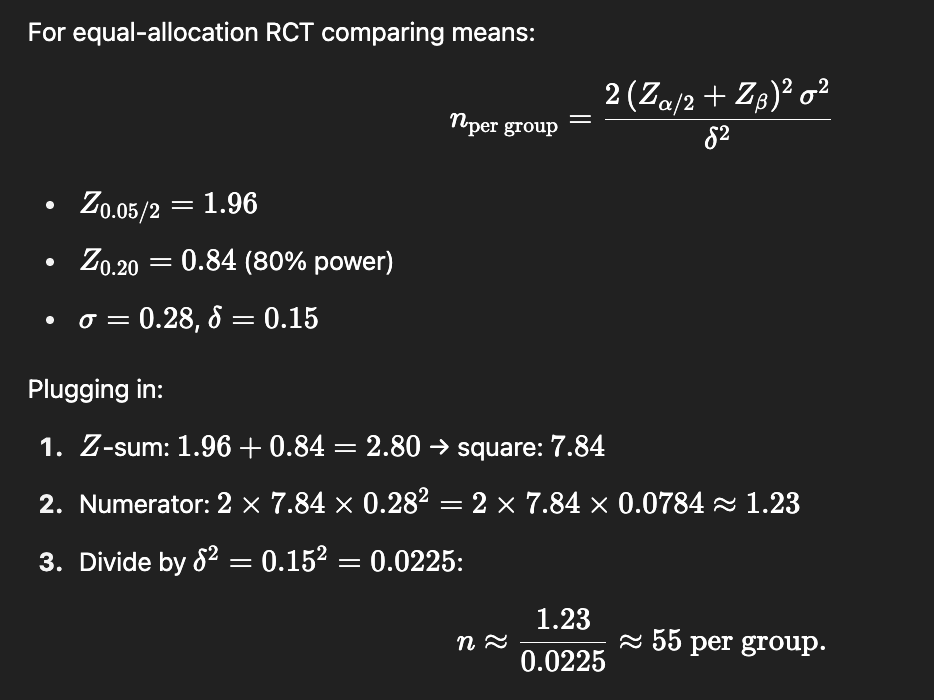
Powered at α = 0.05 and 80% power for a 15-percentage-point difference in CSA loss, the trial needs 138 total patients (65 per arm) — comfortably within the hospital's patient volume.
Results
Powered at α = 0.05 and 80% power for a 15-percentage-point difference in CSA loss, the trial needs 138 total patients (65 per arm) — comfortably within the hospital's patient volume. At roughly 730 eligible admissions per year, that's achievable in well under a year of active recruitment, not the two years originally assumed.
Significance
Delivered to the hospital's team as a consulting analysis.
Reflection
This project was a different kind of contribution than my other case studies — advising someone else's study design with statistics, rather than running my own bench experiment. The real work wasn't the formula; it was translating between what a clinician cares about (will this actually help my patients) and what a trial needs to prove that (a specific, falsifiable, adequately powered question). Fixing the framing before touching the numbers turned out to matter more than the calculation itself.