CTCF
A hidden starvation confound behind inconsistent CTCF
Context
My next project was still in the McCord lab. I worked with Heng Li, a PhD student, under an AURA grant. We'd moved deeper into the cells: I was working with fibroblast and blood cells, and instead of cancer damaging cells, I was watching Heng damage cells himself with X-ray exposure.
One of the ways he verified cellular DNA damage was by measuring CTCF — a protein that binds chromatin at sites of DNA damage to coordinate repair and maintain genome structural integrity.
Question
We expected a straightforward increase in CTCF 24 hours after X-ray-induced DNA damage — so why was the change inconsistent instead?
Approach & rationale
After checking the literature and finding a recent study showing that cellular stress can cause CTCF to phosphorylate and dissociate from its genome binding site, we hypothesized that glucose starvation — not the damage itself — was behind the inconsistency.
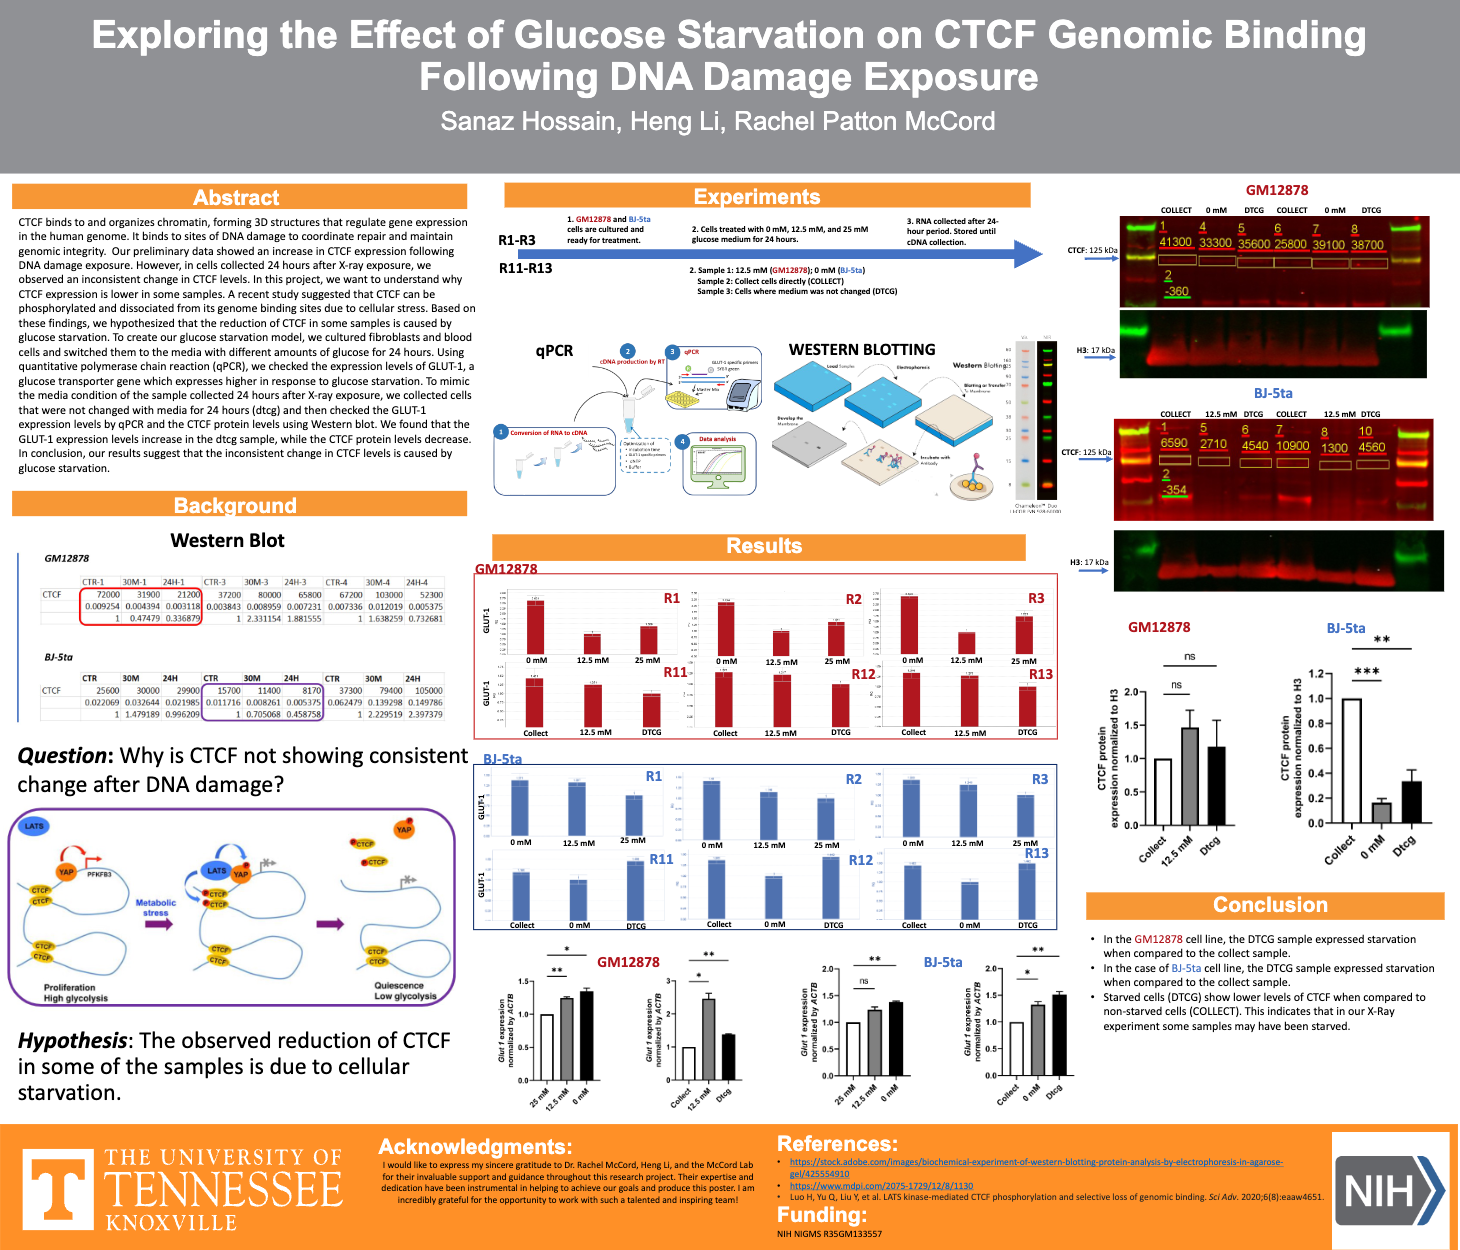
To test that, we designed a glucose-starvation model as a proxy for cellular starvation more broadly: culturing two cell lines — GM12878 (lymphoblastoid) and BJ-5ta (fibroblast) — in 0 mM, 12.5 mM and 25 mM glucose media for 24 hours. We used qPCR to check GLUT-1 expression, a glucose transporter gene that rises under starvation, giving three sample types: definitely starved, definitely unstarved ("Collect" — collected directly, no media change), and an unknown condition ("DTCG" — medium not changed for 24 hours, mimicking how the original X-ray samples were actually collected).
Once GLUT-1 confirmed starvation status, I measured CTCF protein levels by Western blot on the same samples.
Methodology & iteration
Attempt A — trust the CTCF signal directly
Attempt B — rule out a confound before trusting the readout
In short
In BJ-5ta the effect is unmistakable: starved cells carry a fraction of the CTCF that unstarved cells do (0.16× at 0 mM, 0.33× for DTCG, against Collect at 1.00×), reaching significance at p < 0.001 for 0 mM vs.
Results
In BJ-5ta the effect is unmistakable: starved cells carry a fraction of the CTCF that unstarved cells do (0.16× at 0 mM, 0.33× for DTCG, against Collect at 1.00×), reaching significance at p < 0.001 for 0 mM vs. Collect and p < 0.01 for DTCG vs. Collect. DTCG — the condition that mimics how the original X-ray samples were collected — lands with the starved cells rather than with Collect. That is the confound, made visible.
GM12878 did not do the same thing. Its starved conditions read slightly higher than Collect (1.47× and 1.17×) and neither comparison reached significance. So the honest reading is narrower than a claim about both lines: the confound is demonstrated in the fibroblast line and unresolved in the lymphoblastoid one.
What the result does establish is enough to act on: starvation state at collection can move CTCF on its own, so a CTCF reading taken without checking that state cannot be attributed to DNA damage.
GM12878 not reaching significance while BJ-5ta did suggests a cell-type-specific difference in starvation sensitivity that is still an open question.
Significance
This became a first-authored poster, and won at the university's undergraduate research exhibition in May 2023.
Reflection
I presented this at our undergrad research symposium, and I won. But it wasn't a singular win by any means. Without the support of Heng and Dr. McCord, I would have been beyond lost. Their kindness and guidance led me on every step of the way.